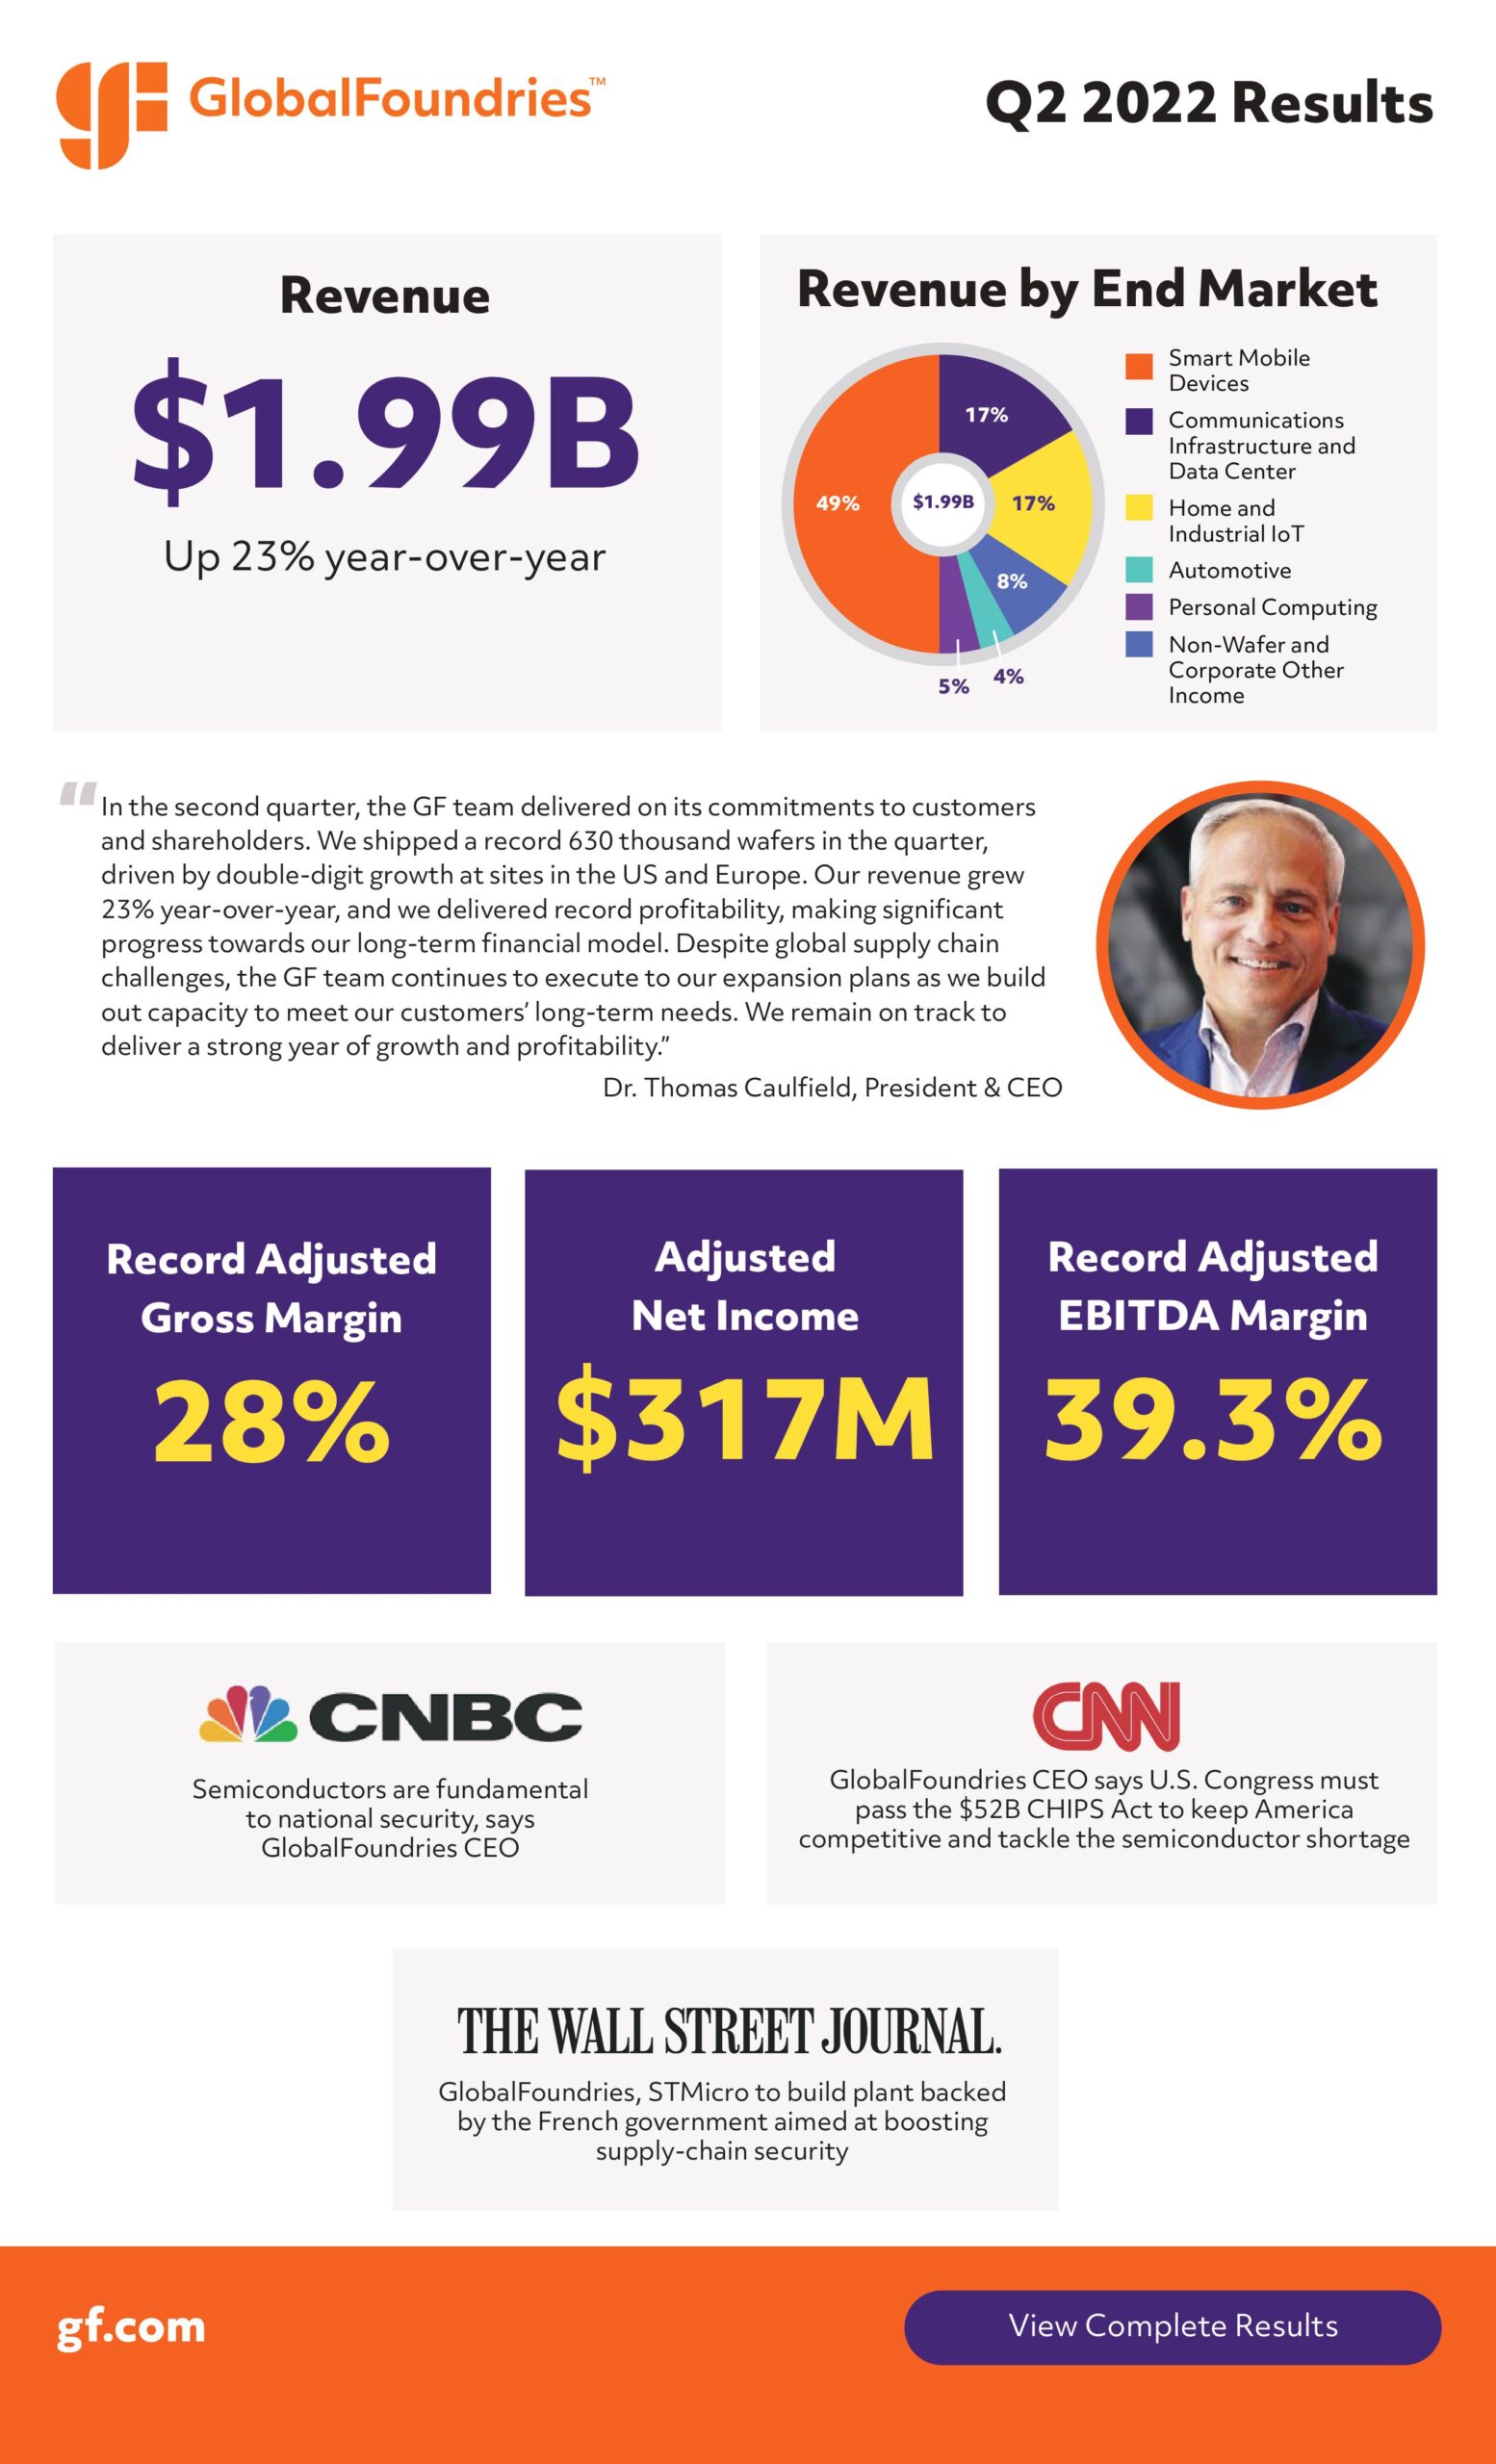
I created this infographic to help GlobalFoundries distill key quarterly earnings highlights into a single, engaging visual. Designed for both internal and external use, the piece presents complex financial performance data in a format that’s easy to scan, share, and understand — whether you’re a stakeholder, employee, or media outlet.
The design balances clean typography, modular layouts, and data-driven graphics to reinforce clarity and brand consistency. It’s structured to guide the viewer through GF’s revenue trends, operational milestones, and strategic wins without overwhelming them with raw numbers.
Project goals:
- Create a repeatable design system for future quarterly updates
- Visualize key earnings data in a digestible, brand-aligned format
- Support internal communications, media relations, and social channels
This piece helps transform dense financial updates into an accessible story — reinforcing GF’s growth and strategic positioning in the global semiconductor space.